Getting a Satellite’s-Eye View of China’s Economic Recovery
This article is part of a series in which experts will analyze the role of science and technology in epidemic response and control in China and around the world.
With the initial battle to control COVID-19 now behind it, China is facing a very different challenge: restarting an economy devastated by several months of lockdowns, quarantines, and travel restrictions.
The first step is getting the lay of the land. In the past, when carrying out investment research and financial analyses, investors were restricted to traditional statistics such as interest rates, the consumer price index, or the purchasing managers’ index — many of which are updated infrequently, sometimes only once a month.
Now, alternative data sources, from sensors to geolocation tools, are giving observers new, real-time windows into the country’s economic health. Through the use of artificial intelligence and big data, investors can perceive, quantify, and predict economic changes as they happen, all of which could help improve decision-making relating to major societal and economic issues.
Even within the field of alternative data, my area of expertise is a bit unique: satellites. As aerospace technology continues to mature, remote-sensing satellites are getting lighter, cheaper, and more plentiful. And the data from the vast majority of noncommercial satellites is accessible to anyone. As a result, investors such as myself can now obtain hourly updates on economic activity, beamed straight from space.
Different types of satellites capture different types of images. For example, my team can use one kind of satellite to follow the construction of infrastructure, and another to check on economic activity by monitoring the intensity of night light within a given region. Sentinel 5P, which was launched in 2017 as part of the European Space Agency’s Copernicus program, tracks nitrogen dioxide (NO₂) emissions. Because an estimated 70%-80% of NO₂ emissions are the result of industrial production, it’s possible to use these images to infer how regional economies have been affected by COVID-19.
In the past, the usability of satellite images was hampered by their technological limitations: Their cameras could be obscured by clouds or fog. But new synthetic-aperture radars can bypass these obstacles, allowing us to monitor the situation anywhere in the world, regardless of weather. Investors can speculate on trade conditions by observing changes in the number of cargo ships in ports, or ascertain the foot traffic of shopping malls by looking at the number of cars in the parking lot.
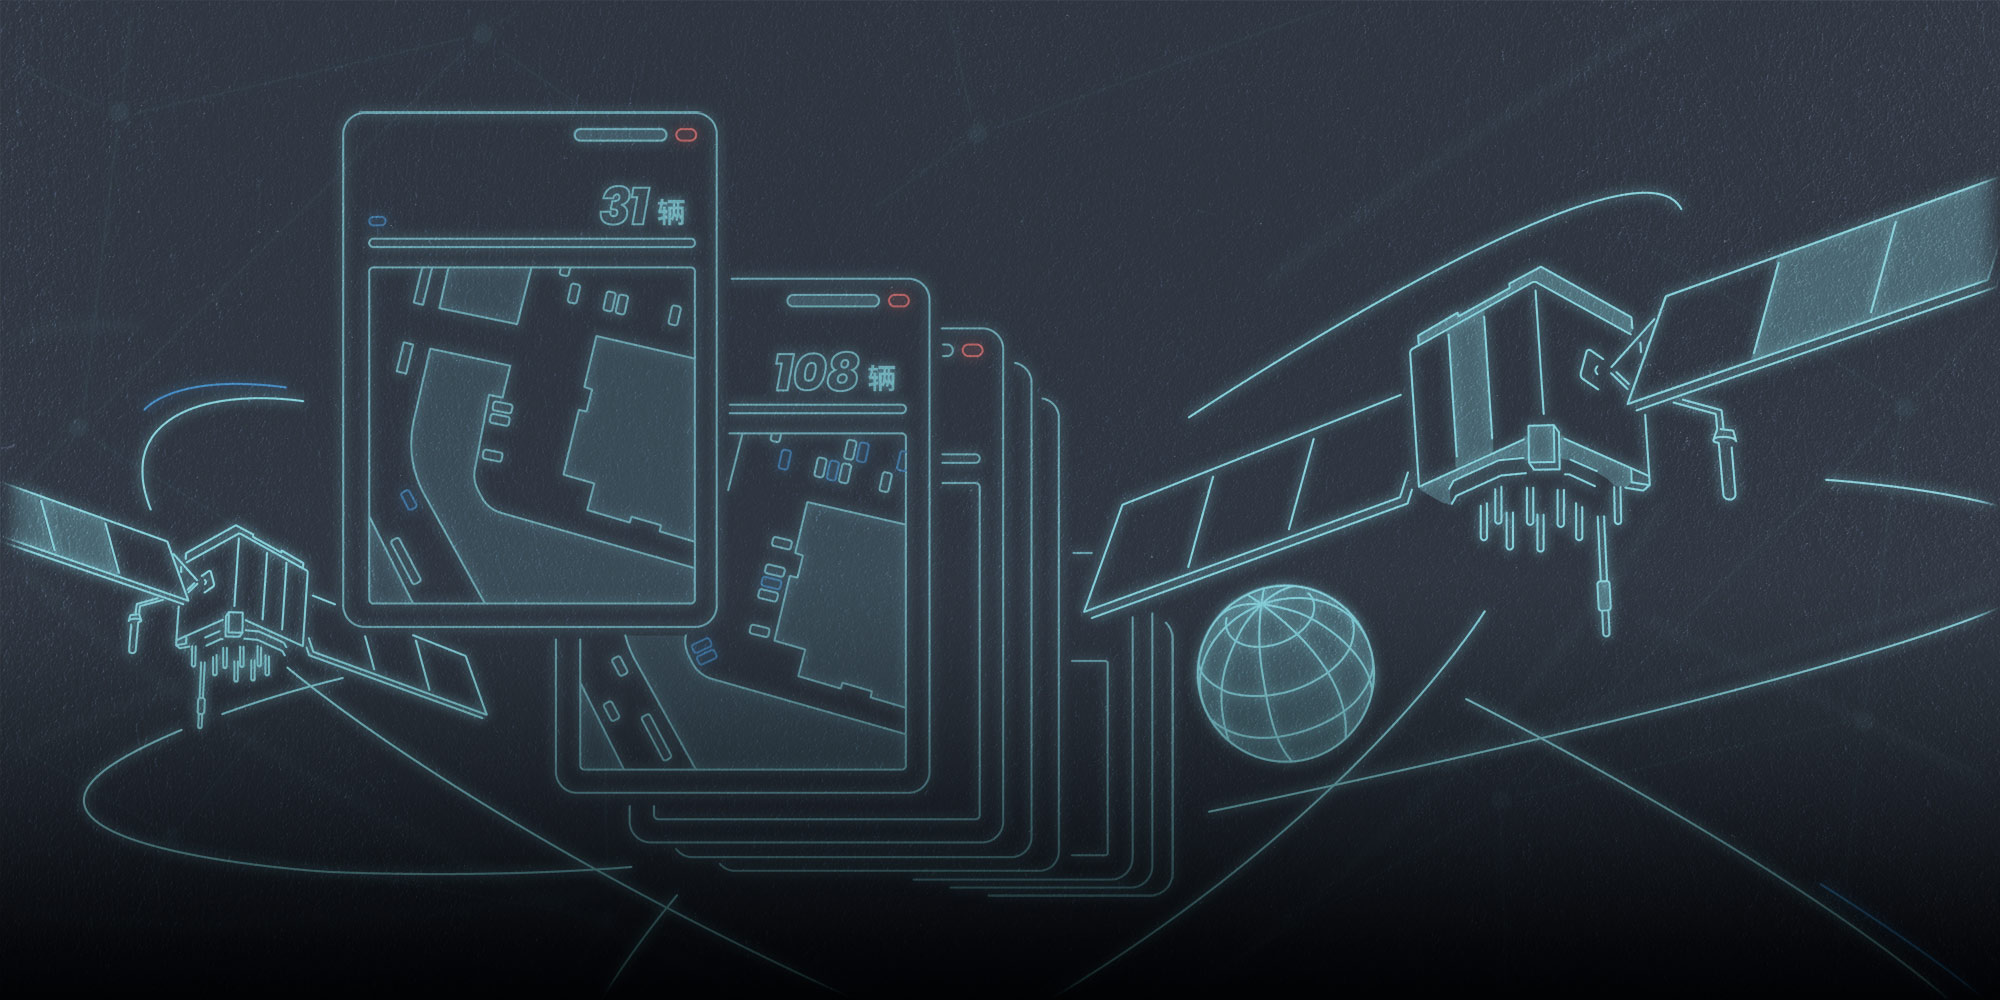
To give a specific example, during the COVID-19 pandemic, my team analyzed the employee parking lot of the Tesla plant in Shanghai using data from China’s Gaofen-2 satellite. While there were only about 18 cars on Jan. 31, there were more than 100 by Feb. 10, confirming media reports that it had fully resumed operations.
Of course, even my team doesn’t have the time to sift through thousands upon thousands of high-resolution images for signs of economic recovery. Instead, we’ve enlisted the help of artificial intelligence.
AI has the power to assess the crude oil reserves of a given nation based on the surface area and size of oil tanks in a particular area, or to recognize crops of corn, soybeans, and rice, and then predict their likely yield. It’s also made it possible for our team to use AI computer vision technology — a field of computational science focused on improving computers’ ability to understand images. With it, we can improve the accuracy of photovoltaic power station recognition in satellite images to over 94%, allowing us to track their installation nationwide.
On a broader scale, my team has developed a Satellite-based Manufacturing Index (SMI) to track changes and progress in China’s manufacturing sector. Take the production of steel, for example. Steel mills’ blast furnaces and electric furnaces operate at extremely high temperatures and generally warm their surroundings. On certain satellite images, these furnaces show up as clusters of bright red dots, allowing us to monitor steel mills’ operation and output.
By analyzing satellite images of key steel mills from September 2019 to now, we found China’s steel industry had recovered from a low of 29% of baseline SMI to nearly 80% in mid-February, and was back up to 90% of the baseline by early March. But production has since fallen as the COVID-19 pandemic has cut into global demand.
For my money, satellite images offer a treasure trove of information. During the pandemic, their promise of real-time, objective data on an immense scale without requiring human contact has been particularly alluring.
Over the next few years, continual technological advancements will likely further reduce the cost of satellite data. Currently, all satellite data is transmitted back to receiving stations and data centers on the ground for processing and analysis. Perhaps one day, we will be able to put a chip with an AI algorithm into satellites so they can analyze images while in orbit and only transmit the information we need. That’s years and several highly complex technological solutions away, but I believe it’s only a matter of time.
Translator: Lewis Wright; editors: Wu Haiyun and Kilian O’Donnell; portrait artist: Wang Zhenhao.
(Header image: Wang Zhenhao for Sixth Tone)